
The Drying of the West
Revisit the Colorado River
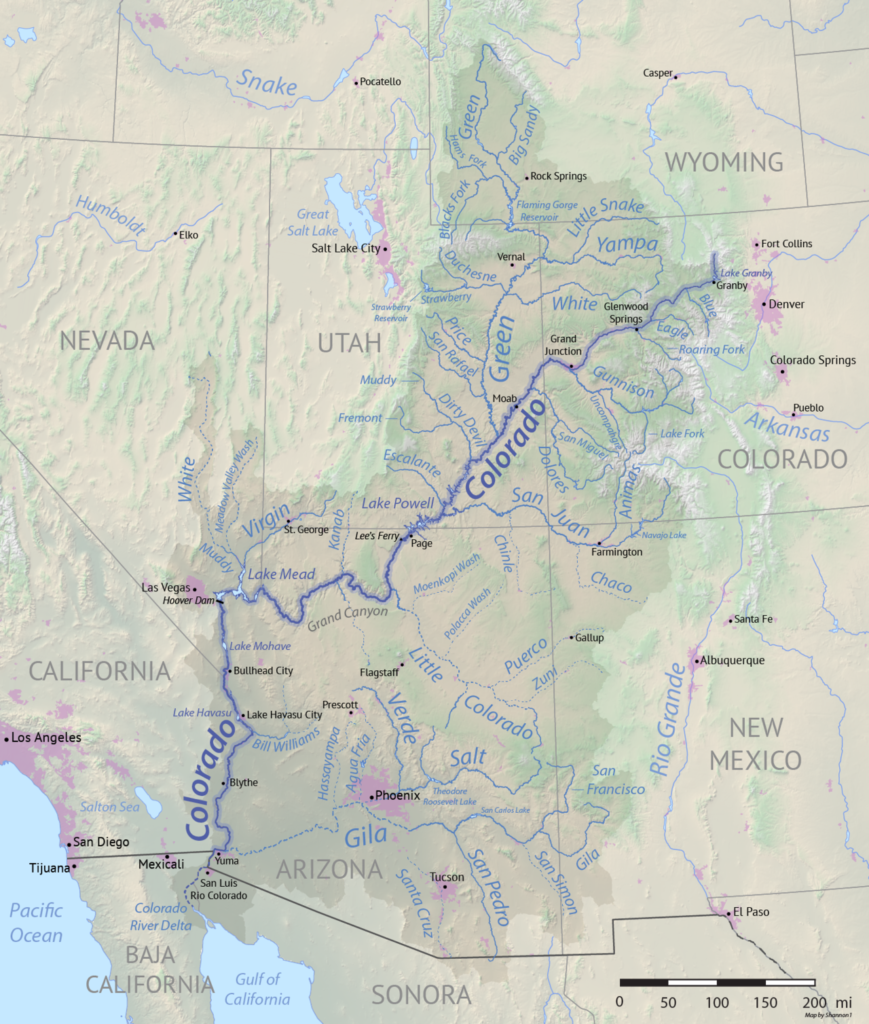
As you hopefully remember from class, the Colorado River starts in north central Colorado, but has tributaries even further north, so that the watershed encompasses parts of seven states. The flow of the river was wildly overallocated so that even in normal times the total of the allotments (16.5 million acre-feet) is greater than the entire flow of the river (which was averaging 16.3 million acre-feet). And these are not normal times. The prolonged drought means that there has been a long term steady decline.
Originally I had planned to try and due a full update about the Colorado, but there is simply too much going on – water levels are dropping and are projected to continue to drop for the next five years (and beyond that too), shortage measures are being applied in areas all over the watershed and there are bodies, WWII landing craft and ghost towns are being exposed in Lake Mead. The best I can do for you here is remind you of the links to the water level data we used in class. If you are interested in following the water levels in Lake Mead and Lake Powell, I recommend these sites:
- The official water levels for Lake Mead are on the Bureau of Reclamation website where they have a new LOWER COLORADO RIVER DAILY REPORT that is replacing the previous static “Present Day” table.
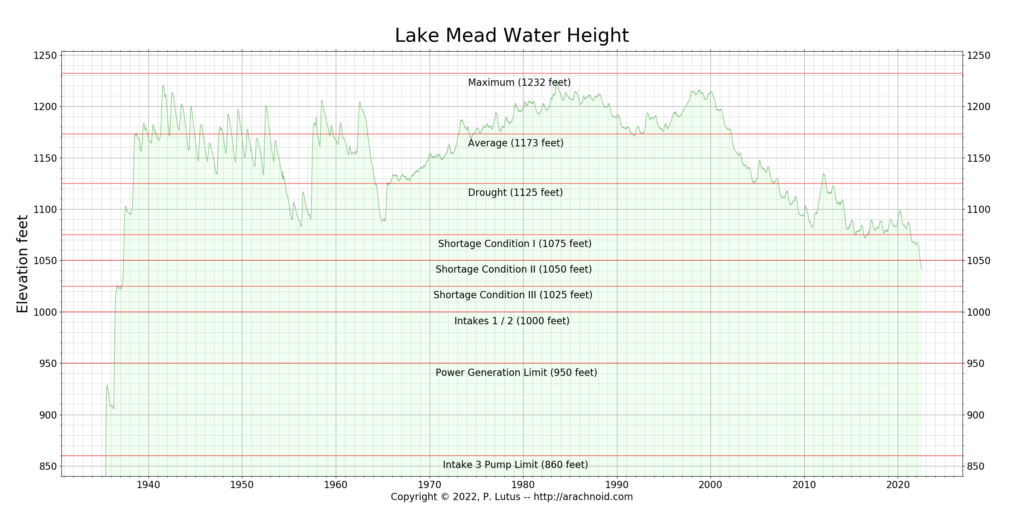
- However, Paul Lutus has maintained an excellent graph of water levels on https://arachnoid.com/NaturalResources/index.html (see image below)
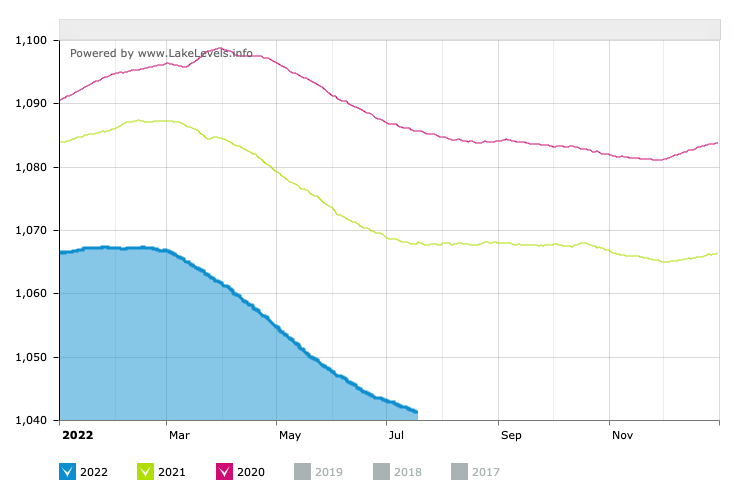
- You can see another interesting way of exploring the data at the Lake Online website (https://mead.uslakes.info/Level/), where data from the last few years is compared.
- The raw data for Lake Powell water levels is also on a Bureau of Reclamation website (https://www.usbr.gov/rsvrWater/rsv40Day.html?siteid=919&reservoirtype=Reservoir)
- But both Arachnoid (https://arachnoid.com/NaturalResources/powell.html)
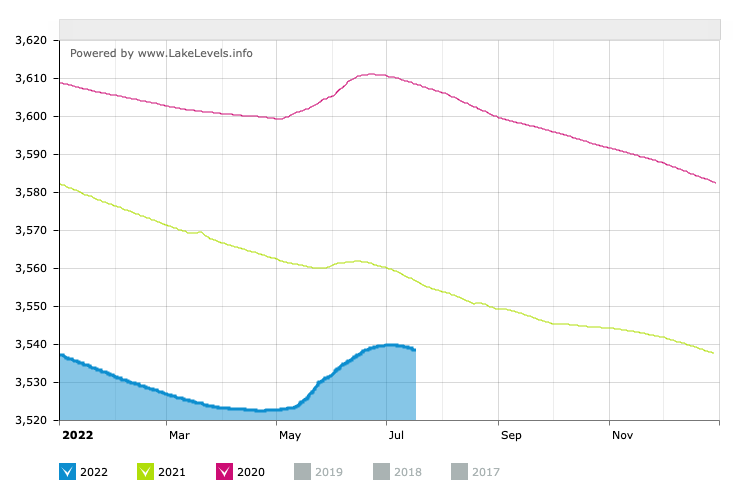
- and LakeLevels (https://powell.uslakes.info/Level/) have graphs for Lake Powell as well
This is why in May 3, 2022, the Bureau of Reclamation announced two emergency measures. First, that under a Drought Contingency Plan adopted in 2019, approximately 500 thousand acre-feet (kaf) of water will be released from Flaming Gorge Reservoir from May 2022 through April 2023. Flaming Gorge Reservoir is the largest reservoir in Wyoming (though it actually laps the boarder into Utah) and is located on the Green River approximately 455 river miles upstream of Lake Powell. Second, that another 480 kaf will be left in Lake Powell by reducing Glen Canyon Dam’s annual release volume from 7.48 maf to 7.0 maf, as outlined in the 2007 Interim Guidelines that control operations of Glen Canyon Dam and Hoover Dam.
- Streamflow data for the lower 48 is available from the USGS at the National Water Dashboard (https://dashboard.waterdata.usgs.gov/app/nwd/?region=lower48&aoi=default) but it might be easier to find some of what you want at the Colorado Basin Roundtable (https://www.coloradobasinroundtable.org/recreation/streamflow-gages/).
And if you are wondering why we are worried about the Colorado River, other than empathy and sympathy for fellow humans and the regional ecosystems, remember – Colorado River water is used to grow about 25% of the nations crops, including about 90% of our winter vegetables. Less water means higher food prices and lower availability for all of us.